DB Performance Monitor by Volade
slow queries, alerts — inside WordPress.
DB Performance Monitor by Volade samples your DB queries: timings, endpoint rankings, threshold alerts, health badge — 4 presets, no mandatory SaaS agent.
3-step workflow
- 1Open Volade → DB Performance
- 2Apply agency-sites, woocommerce-db, high-traffic or debug-queries
- 3Tune thresholds — track slow fingerprints & alerts
WordPress observability 2026
New Relic bills — Query Monitor is dev — custom logs drift
Headless teams and agencies want slow queries + alerts in wp-admin.
⚡ APM
API perf in wp-admin
REST samples, slow fingerprints, alerts, [dbp_badge], presets, JSON export — native APM lite, no New Relic.
Samples
REST captured
4
Presets
Alerts
Slow / error thresholds
JSON
Free export
At a glance
New Relic bills, Query Monitor is dev-only, no prod SQL history. DB Performance Monitor by Volade v1.0.0 samples WP queries: fingerprints, alerts, stub suggestions, [dbp_badge], four presets (agency-sites, woocommerce-db, high-traffic, debug-queries) and JSON export — free without an account. Not New Relic/DBA. No EXPLAIN or auto-ALTER.
Screenshots
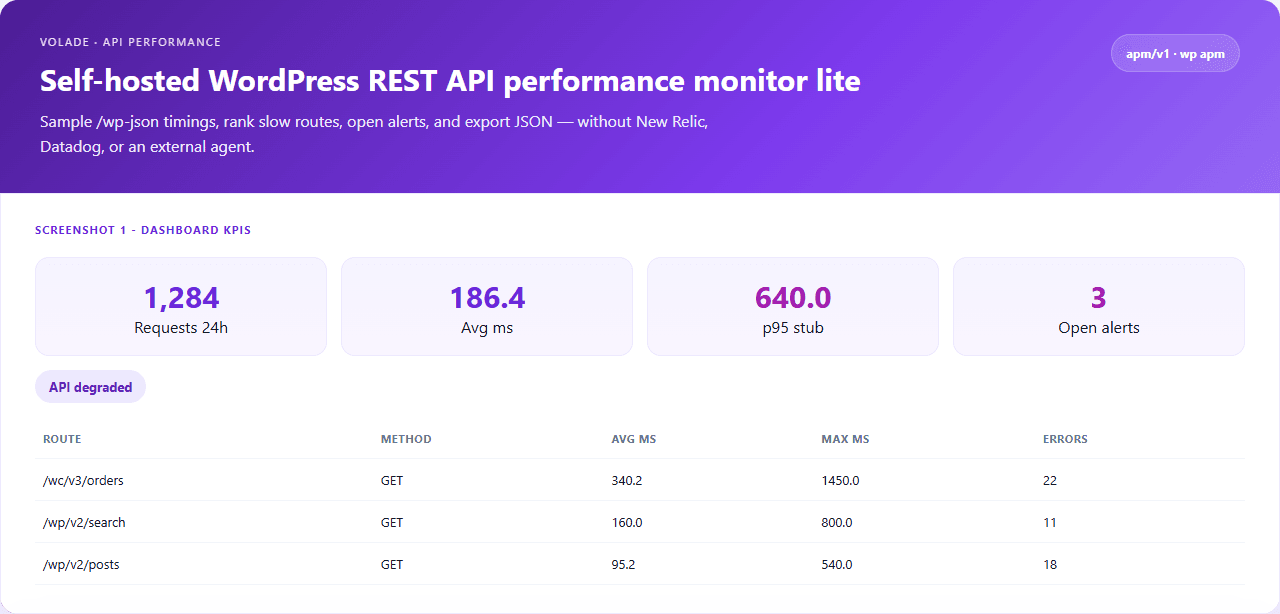
Full-page real admin UI — presets, diagnostics and detailed settings.
2026 tooling compare
New Relic + logs, or APM at $0
New Relic bills. Datadog is heavy. Query Monitor does not historize in prod.
Free core · 4 presets · alerts · sampling · JSON export
SaaS
Typical APM stack
$0
DB Performance Monitor Volade
Why WP teams still lack a clear REST view
New Relic bills; Query Monitor is dev-only; custom logs drift.
The WP API observability problem
You need REST history — not a mandatory SaaS agent.
New Relic bills. Datadog is enterprise. Query Monitor is dev-only. Custom logs drift.
- New Relic / Datadog: agent + volume cost
- Query Monitor: no prod history
- Custom logs: no dashboard or alerts
- No native REST endpoint ranking
- No controlled public health badge
- No CLI / REST for agency fleets
The Volade answer
Samples, rankings, alerts — from wp-admin.
APM samples WP SQL queries, stores locally, and ships 4 presets — no external agent.
- Dashboard Volade → DB Performance
- Samples route / method / status / duration_ms
- Endpoint rankings (avg, max, errors)
- Alerts slow / error_rate / spike
- Configurable sampling (avoid DB blowup)
- Shortcode [dbp_badge] (healthy / degraded)
- 4 presets: agency-sites, woocommerce-db, high-traffic, debug-queries
- Audit events + JSON export + wp dbp
4 monitoring presets
Agency, WooCommerce API, headless or debug spike — one click.
Agency fleet
Agency fleet — high retention, low sample.
agency-sitesWooCommerce API
WC SQL queries — stricter thresholds.
woocommerce-dbHeadless WP
Headless front — higher sample rate.
high-trafficDebug spike
Incident — 100% sample, short retention.
debug-queries4 alert readings
Open, Acked, Resolved and Spike — clear for ops.
Active alert to handle.
Acknowledged, in progress.
Fixed and closed.
Abnormal peak detected.
Alerts help catch REST regressions without a SaaS agent.
Same day, REST monitoring live
agency-sites preset — live rankings, alerts in admin.
Preset
agency-sites applied.
Badge
[dbp_badge] healthy/degraded.
Alerts
Slow routes on dashboard.
Export
apm-export.json for backups.
fingerprints preview
Agency fleet — 12 routes · 3 open alerts
Thresholds + sampling + JSON export for the team.
Real scenarios
What changes after activation.
Multi-site agency
Before: No REST history
After: agency-sites
Fleet visibility
WC store
Before: Slow API undetected
After: woocommerce-db
WC thresholds
Headless
Before: Blind front
After: high-traffic
High sample
Incident
Before: Random debug
After: debug-queries
100% sample
What New Relic and Query Monitor alone do not offer
Native REST history, endpoint rankings, alerts and export — in wp-admin, no SaaS agent.
REST sampling
Capture route, method, status, duration_ms.
Endpoint rankings
Hits, avg/max ms, error rate.
Threshold alerts
Slow, error_rate, spike — open/acked/resolved.
Hashed IP
Never store raw IP — hash only.
Health badge
[dbp_badge] / [dbp_status] — healthy or degraded.
4 presets
agency-sites, woocommerce-db, high-traffic, debug-queries.
Audit trail
Timestamped events on key actions.
WP-CLI + REST
wp dbp · dbp/v1 status / export.
Lite native wp dbp — not New Relic/Datadog/Query Monitor, no distributed tracing.
What teams use
July 2026 landscape — WordPress vs external tools.
New Relic
SaaS
Full APM — agent + volume cost.
Datadog
SaaS
Enterprise observability, WP overkill.
Query Monitor
Dev
Great locally, no prod history.
Custom logs
Fragile
Homegrown scripts, no dashboard.
Nothing
Blind
Slow fingerprints undetected.
DB Performance Monitor by Volade
$0
REST samples, alerts, [dbp_badge], 4 presets, REST + CLI.
Observability × WordPress landscape 2026
New Relic, Query Monitor, custom logs vs a wp-admin REST APM.
New Relic
Full SaaS APM.
Limit: Agent + volume cost, not native WP.
Datadog
Enterprise observability.
Limit: Overkill / SMB cost.
Query Monitor
WordPress dev debug.
Limit: No prod history.
Custom logs
Homegrown scripts.
Limit: No dashboard or alerts.
Application Insights
Azure cloud APM.
Limit: Not native WordPress.
Do nothing
Unmonitored API.
Limit: Regressions undetected.
Comparison table — 5 approaches
APM vs New Relic, Query Monitor, custom logs and no tool.
| Feature | APM Volade | New Relic | Query Monitor | Custom logs | Nothing |
|---|---|---|---|---|---|
| Native WP REST history | ~ | ~ | |||
| Endpoint rankings + alerts | |||||
| No SaaS agent (core) | |||||
| Industry presets | |||||
| Health badge [dbp_badge] | |||||
| JSON export + WP-CLI | ~ | ~ | |||
| Hashed IP (privacy) | ~ | ~ | |||
| Data on your server | |||||
| Typical yearly cost | $0 | SaaS | $0 | Dev | $0 |
Not New Relic/Datadog/Query Monitor. No distributed tracing. Sampling may miss spikes. IPs hashed only.
Three tiers, one plugin
Samples, alerts and JSON export free. Volade account for REST. V+ for multisite rollup.
No account
- Samples & fingerprints
- Threshold alerts
- 4 presets
- Health badge
- JSON export
Volade account
- REST dbp/v1
- Stats
- Remote sync
V+ Premium
- Multisite rollup
- wp dbp network
- Fleet harmonization
WP-CLI `wp dbp` and REST `dbp/v1` for status, preset, list and export.
WP-CLI
status, preset, list, export — `wp dbp preset agency-sites`.
wp dbp status
wp dbp preset agency-sites
wp dbp export
Multisite
Samples per site; network presets; rollup on V+.
- Samples per blog
- Consolidated export
- Network presets
Download
Install the ZIP, open Volade → DB Performance, apply agency-sites.
ZIP with Volade SDK — Volade → DB Performance.
- 1Plugins → Add New → Upload → ZIP → Activate
- 2Volade → DB Performance
- 3Pick a preset → tune thresholds → track slow fingerprints
Monitoring live in under 2 minutes
FAQ
New Relic, Query Monitor, sampling, presets, REST, multisite and privacy.
No. DB Performance Monitor is a lite native wp dbp for SQL queries. No agent or distributed tracing.
Free vs V+ Premium
The extension works without an account. V+ unlocks premium on this extension and the full catalog.
| Feature | Free | V+ |
|---|---|---|
| SQL samples, fingerprints & alerts | ||
| 4 agency-sites / woocommerce-db / high-traffic / debug-queries presets | ||
| [dbp_badge], stub suggestions & audit | ||
| Dashboard & free JSON export | ||
| Programmatic dbp/v1/* REST API (connected) | ||
| Network rollup & multisite |
Reviews, discussions & updates
Share your experience with DB Performance Monitor by Volade and follow the latest releases.
Ready for native REST monitoring on WordPress?
Download DB Performance Monitor by Volade v1.0.0 — one-click preset, no signup.
Download v1.0.0